The Flow of Immigrant Fiancés to the United States
A report by Boundless uses public data to understand national trends in K-1 fiancé visa applications
Key Findings
• The number of fiancé visa applications stuck in limbo under Trump more than doubled the amount during Obama’s final days in office, reaching more than 30,000 in late 2018 and finishing at 21,000 at the end of 2020.
• Under Obama, the number of fiancé visas issued reached as high as 17,600 in a single quarter, while only 4,470 were issued in Trump’s final quarter as president.
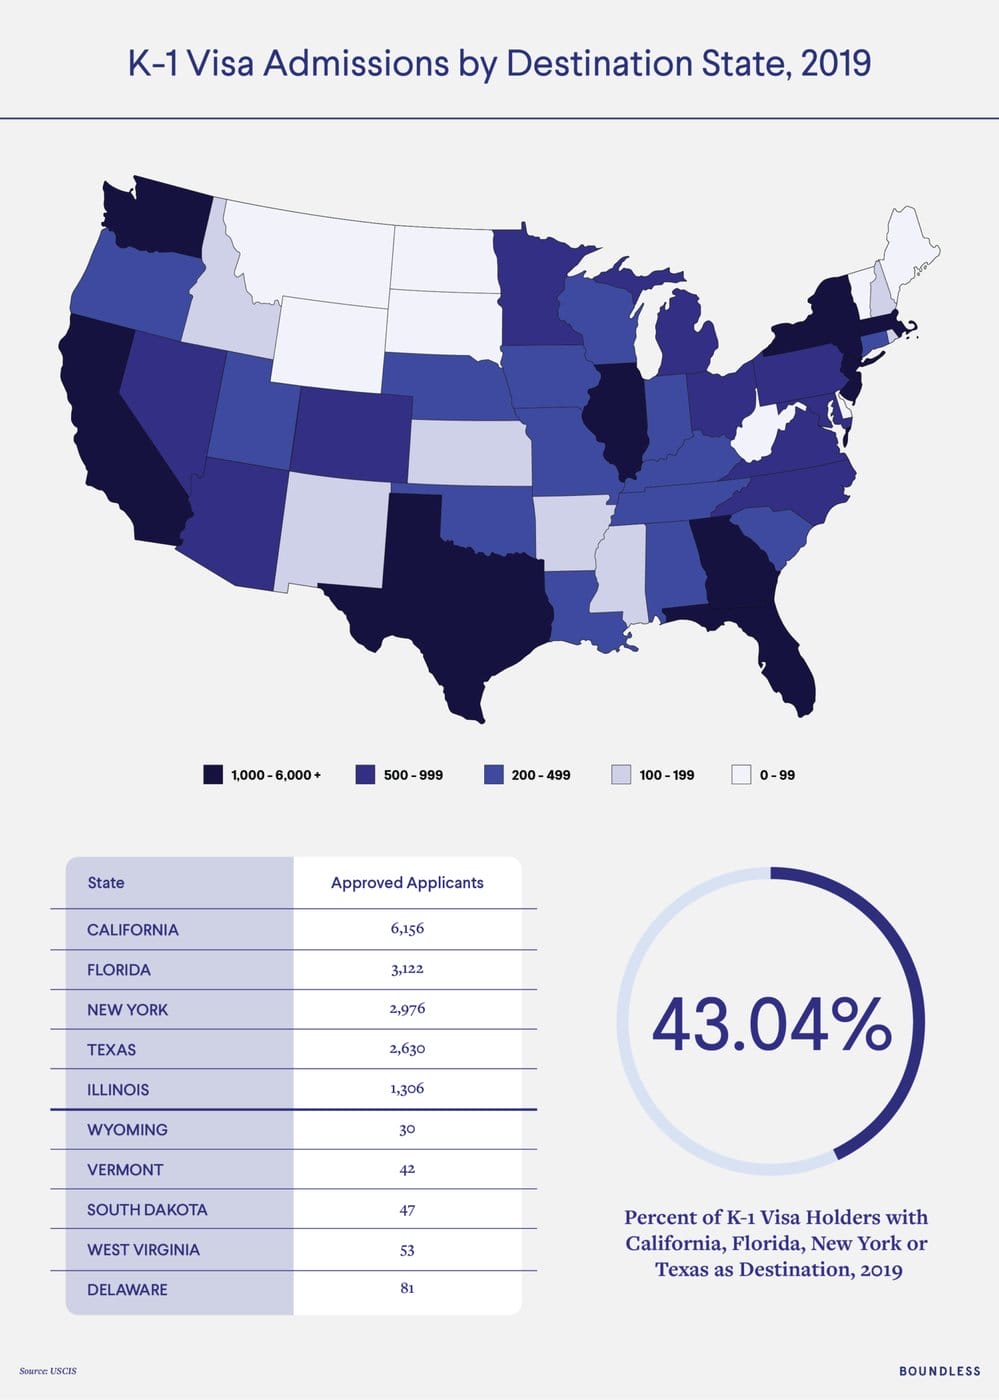
• Those immigrants lucky enough to receive their fiancé visa usually had one of six destinations in mind – California, Florida, Texas, New York, Illinois or Washington. In 2019 alone, California welcomed 6,156 fiancé visa recipients.
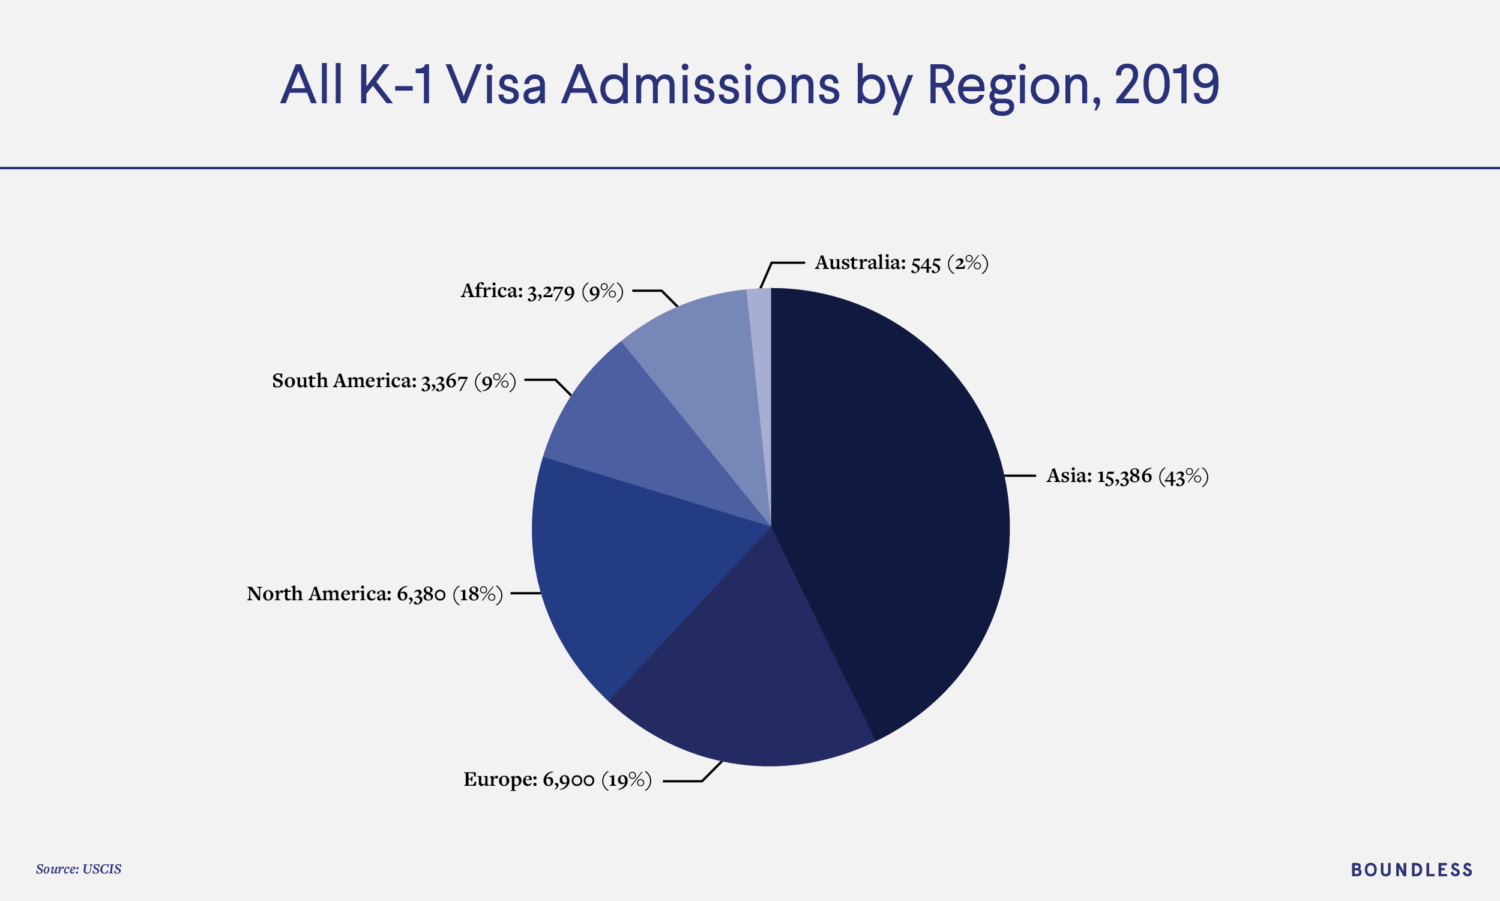
• The majority of K-1 visas are from Asia – particularly the Philippines.
K-1 Visa Admissions
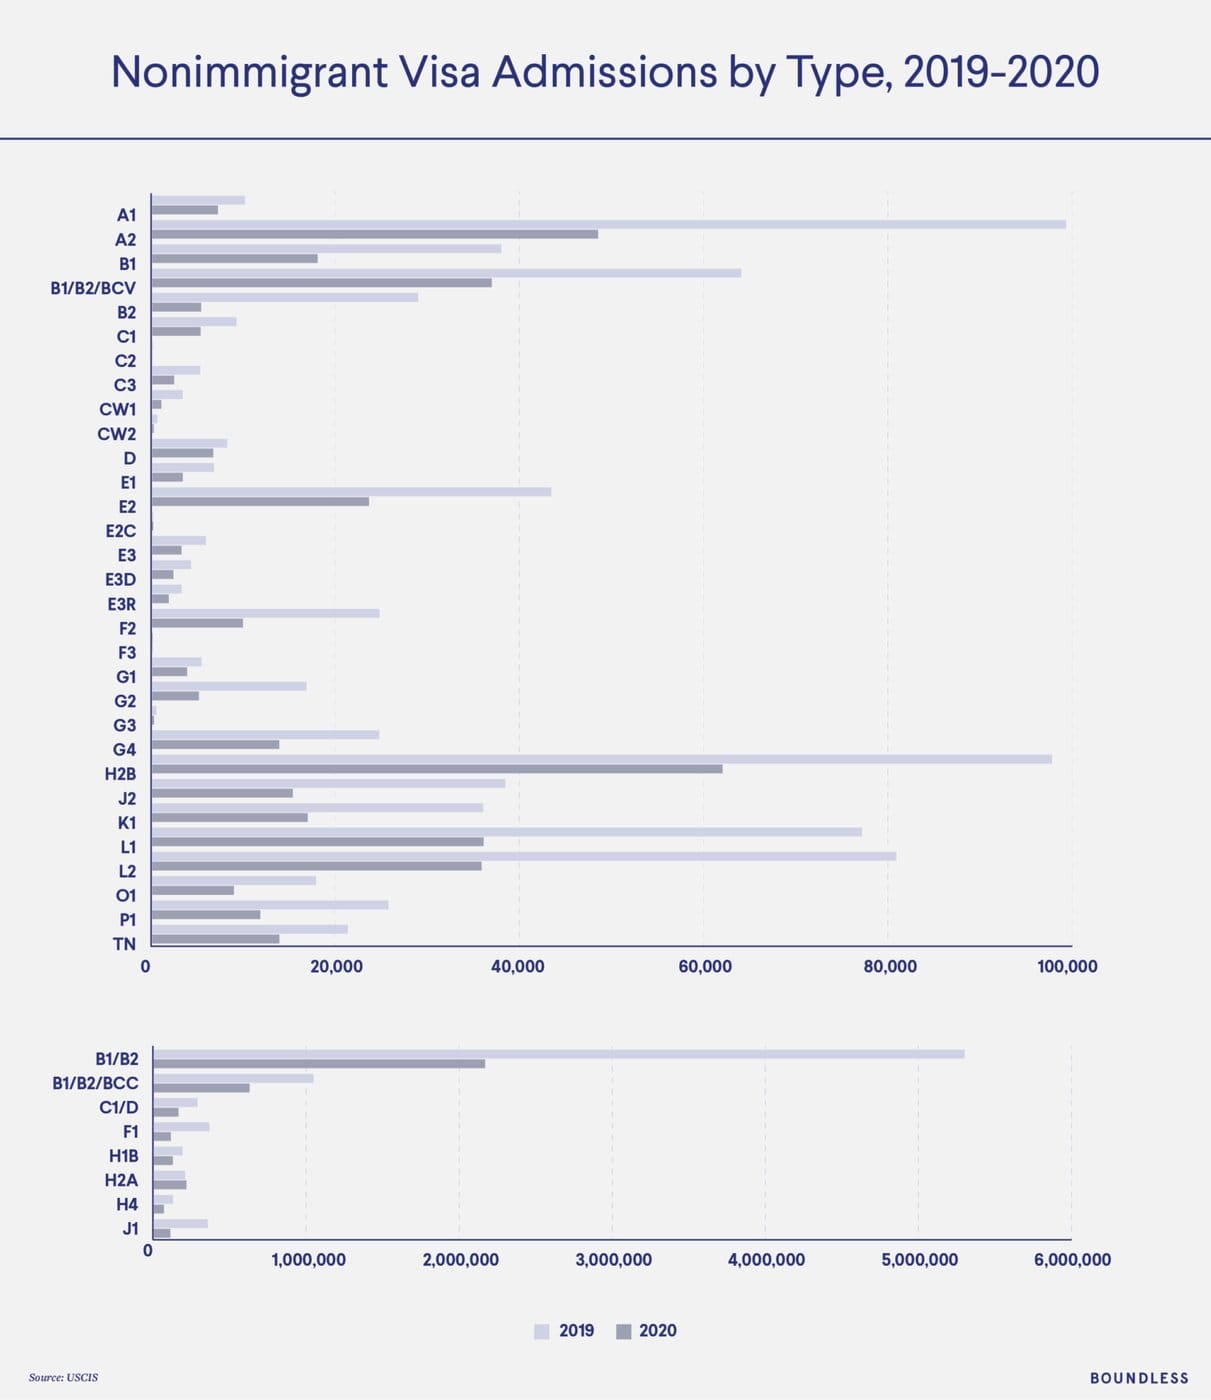
Compared to other visa types, the K-1 visa has a smaller number of annual admissions. In 2019, the K-1 visa had 34,581 admissions. In comparison, the B-2 tourist visa had 6M annual admissions in 2019. Annual K-1 visas made up only 0.04% of all nonimmigrant visas in 2019.
I-129F Approvals and Denials
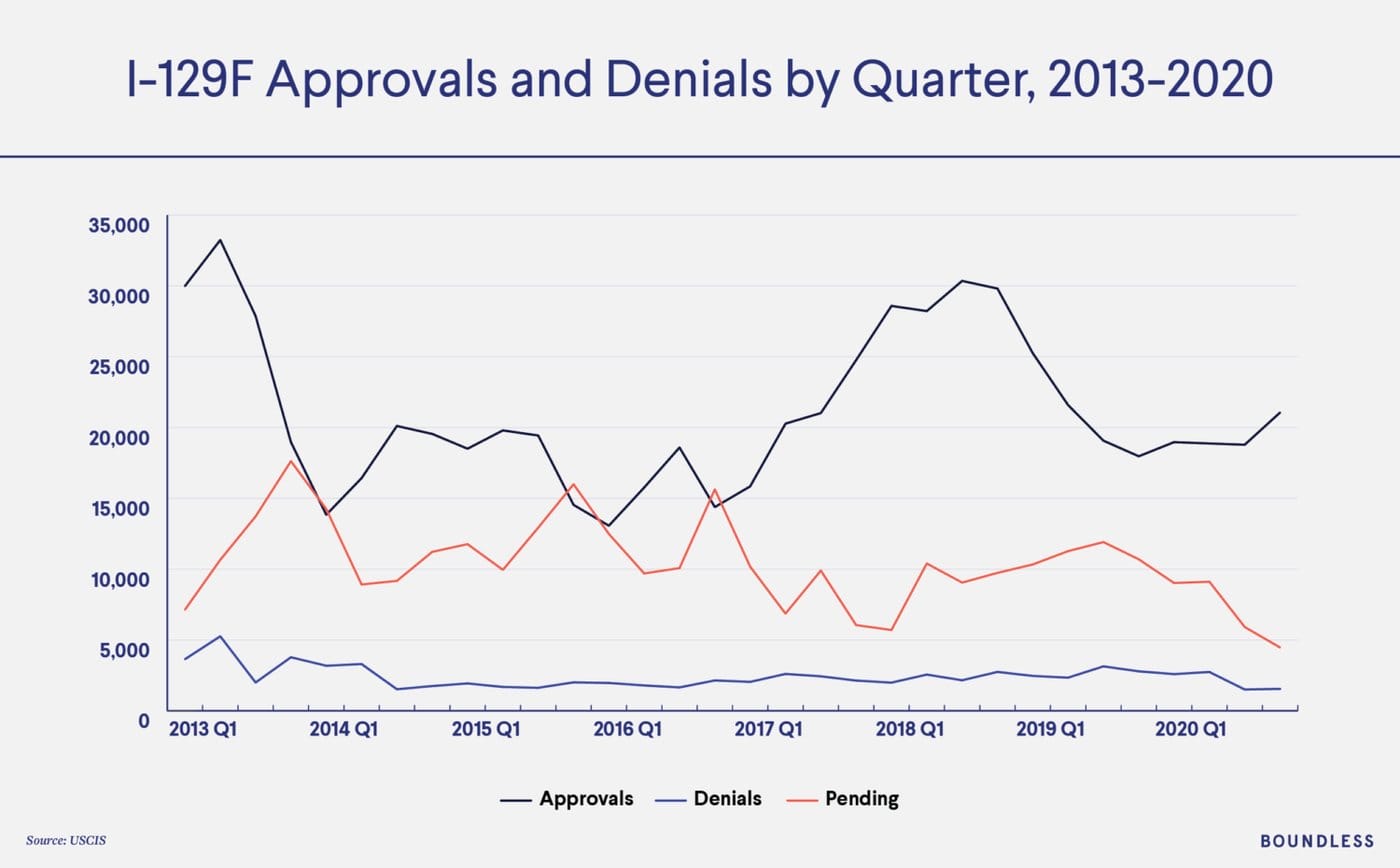
The I-129F is the form that U.S. citizens file to bring their future spouse to live with them in the United States. I-129F pending applications rose steadily from 2017 Q1 to 2018 Q3. After a decrease from 2018 to 2019, pending applications are now rising again in 2020. I-129F approvals have seen a decrease since 2019 Q3, while denials have remained relatively stable throughout 2019 and 2020 with a small decrease between 2020 Q2 and 2020 Q3.
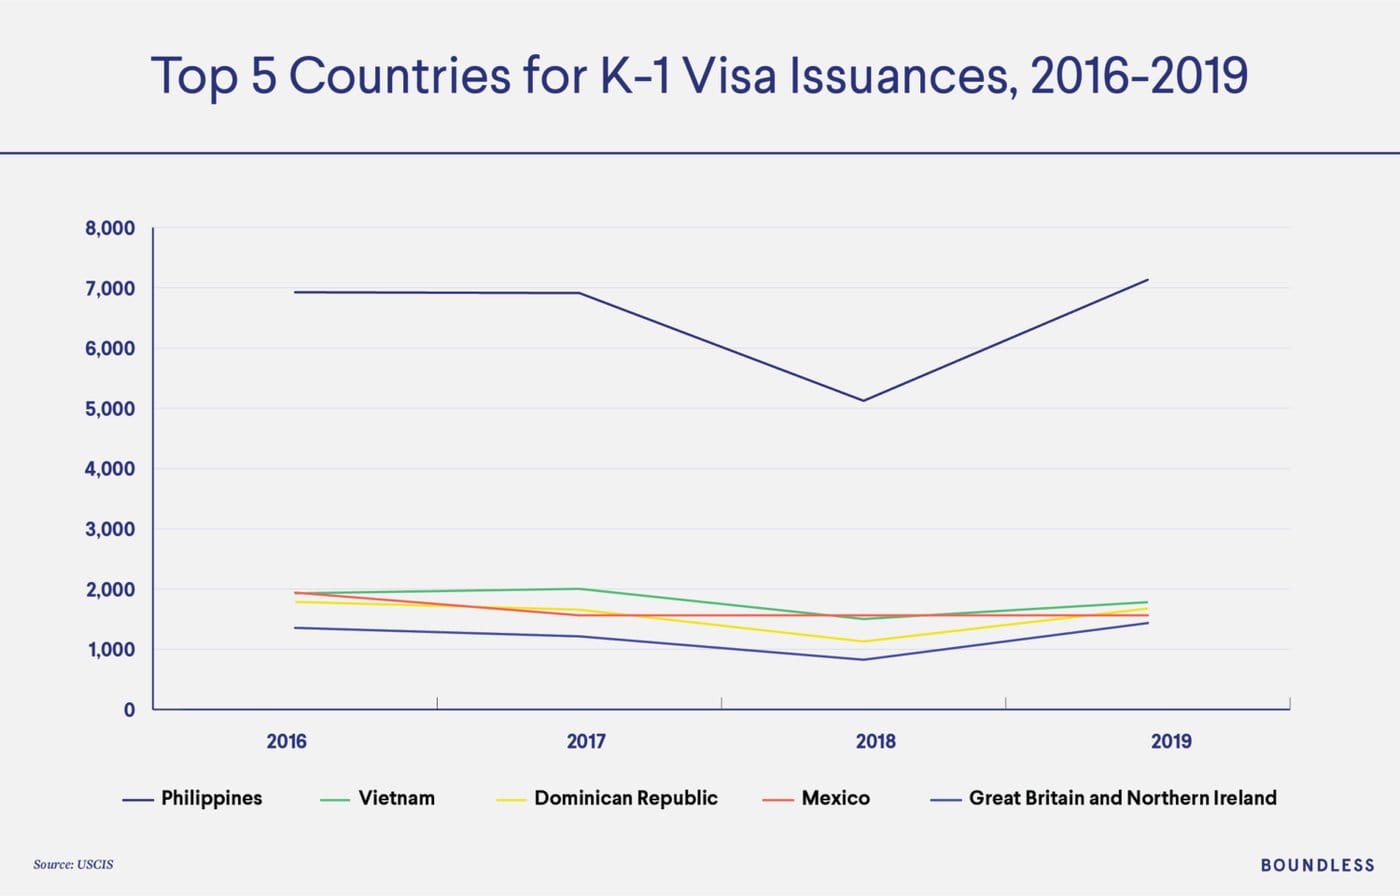
Where do most K-1 visa holders come from?
The majority of K-1 visas are from Asia – particularly the Philippines. In 2019, 7,134 K-1 visas were issued from the Philippines. Other top countries include Vietnam (1,782), Mexico (1,676), and Great Britain/Northern Ireland (1,435).
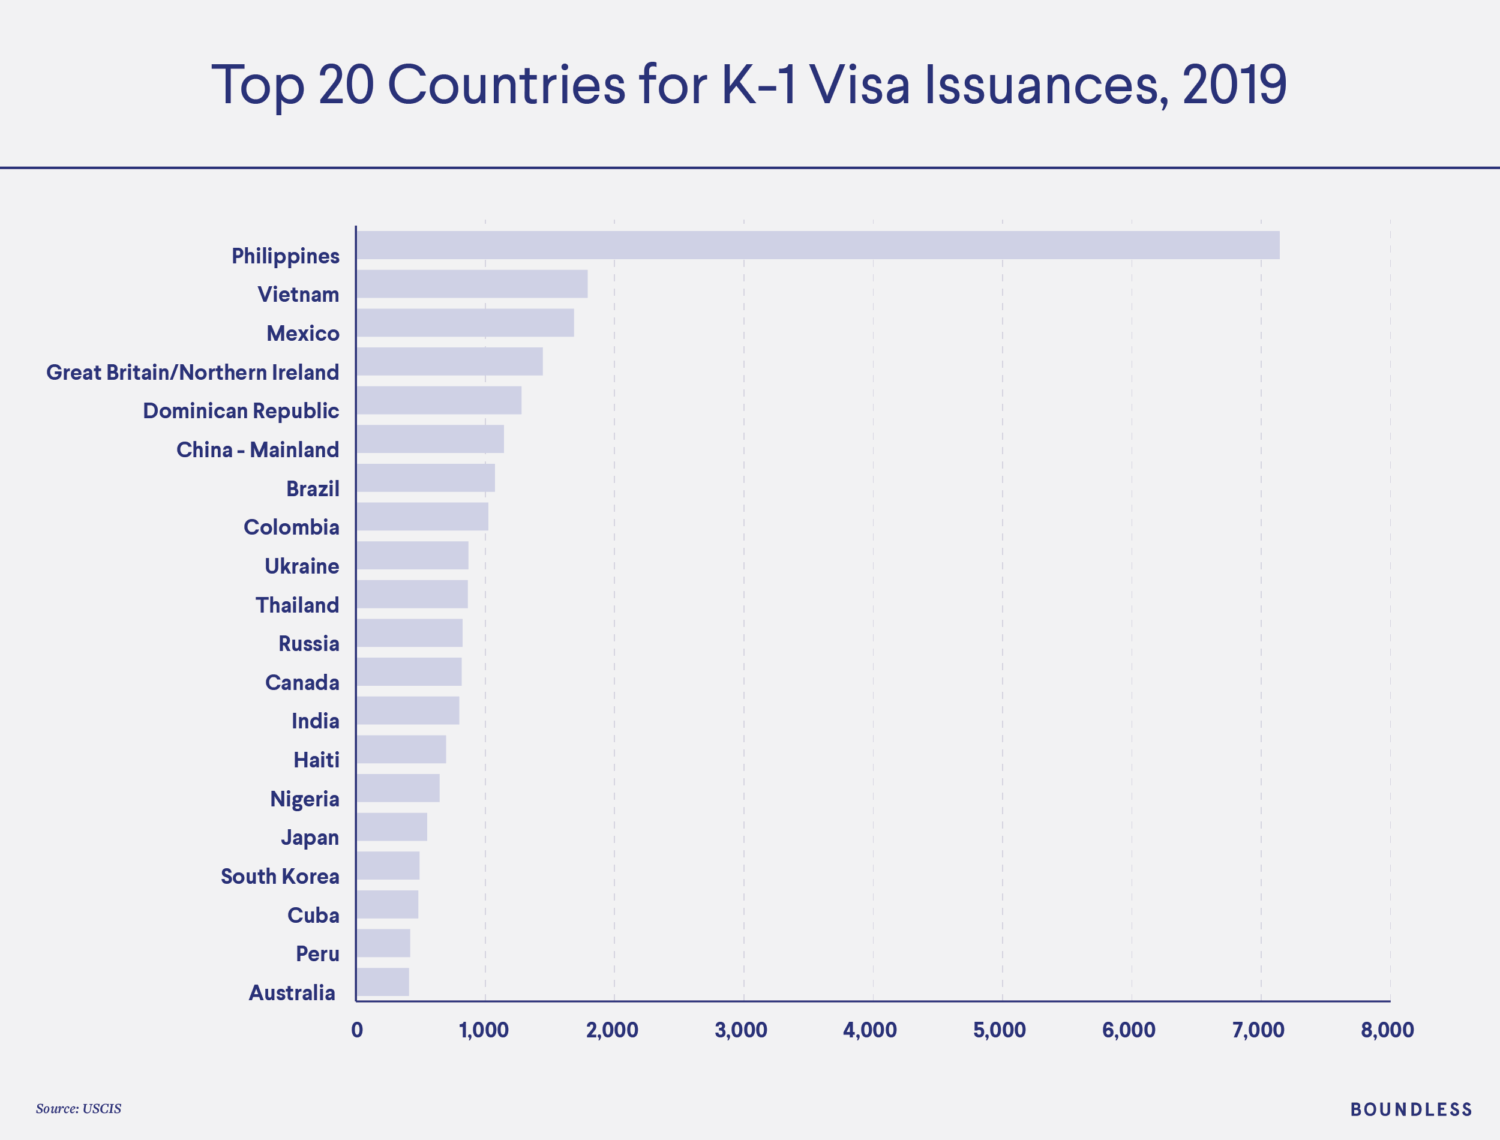
K-1 visa approvals show similar trends over time, with most being issued to individuals in the Philippines. Since 2005, the number of Filipino K-1 visas has grown rapidly with about 4,423 visas in 2005. In 2019, Filipino K-1 visas totaled at 7,134 – about a 61% increase. Issuances decreased in 2018, with the Philippines seeing the largest decrease. However, issuances increased back to a similar level in 2019.
Where do most K-1 visa holders go?
California, Florida, New York, and Texas were the most common destinations for K-1 visa holders in 2019. Of the 34,581 K-1 visa holders in 2019, 43% listed these four states as their destination.
About the Data
Data from this report comes from U.S. Citizenship and Immigration Services.